How to Read a Crypto Chart (For Beginners)
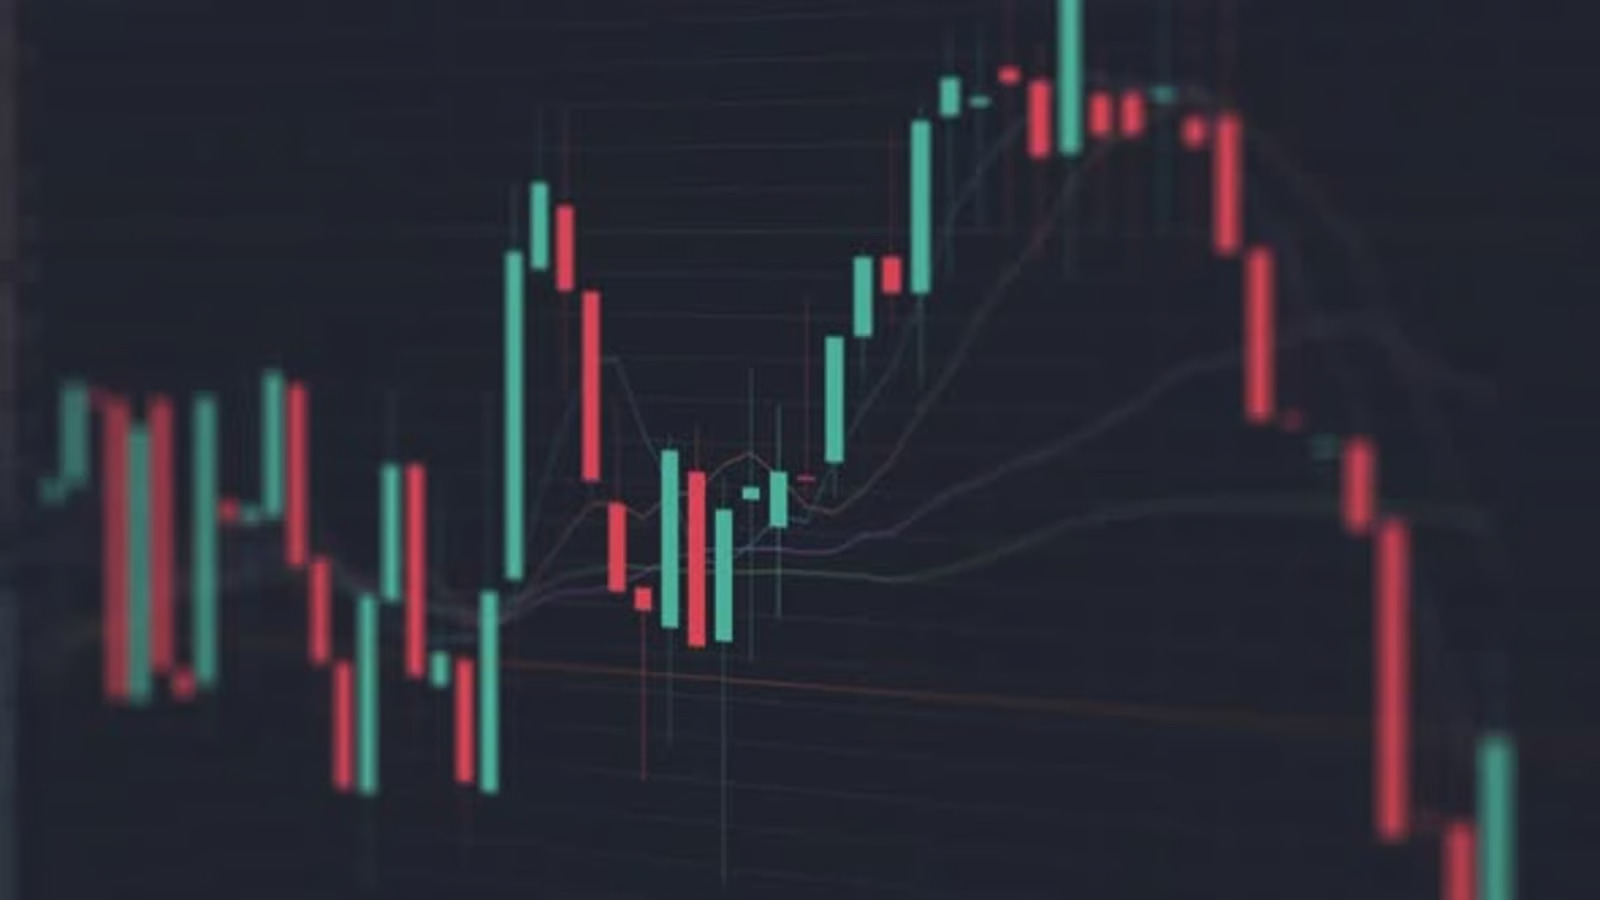
If you've ever opened a crypto exchange and stared at a screen full of candles, lines, and numbers feeling completely lost you're not alone. Reading a cryptocurrency price chart for the first time can feel like trying to read a foreign language. But here's the truth: once you understand the basics, charts become one of the most powerful tools for making smarter decisions in crypto.
In this beginner's guide, we'll break down everything you need to know step by step, in plain English so you can start reading crypto charts with confidence.
Why Reading a Crypto Chart Matters
Crypto markets are volatile. Prices can move 10%, 20%, or even 50% in a single day. Without understanding how to interpret a crypto price chart, you're essentially flying blind. Charts give you a visual history of what buyers and sellers have been doing and when you know how to read them, you can spot trends, identify good entry points, and better manage your risk.
You don't need to become a professional trader. Even a basic understanding of charts will put you ahead of most beginners who buy and sell on emotion alone.
Step 1 — Understand What a Crypto Chart Actually Shows
A crypto chart is a visual representation of a cryptocurrency's price over time. The horizontal axis (X-axis) shows time, while the vertical axis (Y-axis) shows price. Every chart gives you a snapshot of market activity during a chosen time period.
You'll typically see options to change the timeframe 1 minute, 15 minutes, 1 hour, 1 day, 1 week, and so on. A beginner-friendly tip: start with the daily (1D) chart to see the bigger picture without getting overwhelmed by short-term noise.
Step 2 — Learn to Read Candlestick Charts
The most common type of crypto chart is the candlestick chart. Each "candle" tells you four things about the price during that time period:
• Open — the price at the start of the period
• Close — the price at the end of the period
• High — the highest price reached during the period
• Low — the lowest price reached during the period
A green (or white) candle means the price went up the close was higher than the open. A red (or black) candle means the price went down. The thin lines above and below the candle body are called "wicks" or "shadows," and they show the highest and lowest prices during that period.
Pro tip: A candle with a very long wick often signals indecision or a potential reversal in price direction — something worth watching closely.
Step 3 — Check the Trading Volume
Just below most crypto charts, you'll see a bar graph showing trading volume the total amount of a cryptocurrency that was bought and sold in a given period. Volume is one of the most important (and most overlooked) indicators for beginners.
Here's the simple rule: a strong price move backed by high volume is more reliable than a move on low volume. If Bitcoin's price jumps 15% but volume is unusually low, that move might not last. But if it jumps 15% with a spike in trading volume, there's real conviction behind it.
Step 4 — Identify Support and Resistance Levels
Support and resistance are two of the most fundamental concepts in technical analysis, and they're easier to understand than they sound.
• Support is a price level where a crypto tends to stop falling and bounce back up. Think of it as a "floor."
• Resistance is a price level where a crypto tends to stop rising and pull back. Think of it as a "ceiling."
These levels form because many traders have their buy and sell orders clustered around the same price points. When you can identify where support and resistance sit on a chart, you start to understand why prices move the way they do — and you can make more informed decisions about when to enter or exit a trade.
Step 5 — Use Moving Averages to Spot Trends
A moving average (MA) is a line drawn on the chart that smooths out price fluctuations over a set number of periods. The two most common ones you'll see are the 50-day moving average and the 200-day moving average.
When the price is above the moving average, that's generally considered a bullish (upward) trend. When it's below, it's often seen as bearish (downward). A popular signal among crypto traders is the "Golden Cross" when the 50-day MA crosses above the 200-day MA — which many interpret as a strong buy signal.
You don't need to memorize all of this right now. The key takeaway is: moving averages help you see the big-picture trend instead of reacting to every daily price swing.
Common Mistakes Beginners Make When Reading Crypto Charts
• Only looking at short timeframes (1-minute or 5-minute charts) and getting caught up in noise
• Ignoring volume and basing decisions purely on price movement
• Using too many indicators at once, which leads to confusion and analysis paralysis
• Treating every signal as a guaranteed outcome charts show probabilities, not certainties
Where to Practice Reading Crypto Charts for Free
TradingView is by far the most popular and beginner-friendly charting platform in the crypto space. It's free to use, has an enormous community sharing chart analyses, and supports virtually every cryptocurrency. Simply search for any coin (e.g., "BTCUSD" for Bitcoin) and you'll have access to all the tools covered in this guide.
Most major exchanges like Binance, Coinbase Advanced, and Kraken also have built-in charting tools. Start there, keep your charts simple, and practice identifying candles, volume, and support/resistance levels on historical data.
Final Thoughts: Keep It Simple and Stay Consistent
Learning how to read a cryptocurrency chart doesn't happen overnight but it doesn't have to take years either. Start with the fundamentals: understand what candlesticks tell you, always check volume, look for support and resistance, and use a moving average to confirm the trend. These four elements alone will give you a much stronger foundation than most beginners have.
Remember: the goal isn't to predict the future it's to make more informed decisions with the information you have. Charts are tools, not crystal balls. The more you practice, the more patterns you'll recognize, and the more confident you'll become navigating the crypto market.